Summary
As of August 2022, We decided to switch to OpenSearch in the infra team for gathering our logs to have better search-ability on them.
Quick Start
OpenSearch URL
- ACE OpenSearch Home: https://logs.gred.ai/_dashboards
Please note that this is only accessible from the office or over the enterprise VPN.
OpenSearch Terraform Code
Github Repo: Terraform-ace-prod
Access
OpenSearch authentication is done via Okta SAML.
You can see authorization configs in: Navigation bar at the left > security > roles
All gred teams that have been added to Okta have read-only access to OpenSearch. And ace-infra team as OpenSearch Admins has full access to this tool.
If you want to give access to a service for read/write in a index, you should use service ARN to do mapping users to roles. Here is an example: link
Architecture
Terminology
Here are some terms of OpenSearch which will help you to understand the document more and better:
- Documents: data logs are stored in a JSON format called documents, similar to rows in database
- Index: documents are saved in the index, imaging it as a database.
- Index Mapping: structure of the index is defined by index mapping, imagine it as the schema of the database.
- Index pattern: we can show multiple indices in one index pattern if they are following the same naming pattern with wildcard and the same mapping
- Shards: sharding is a way to divide indices into smaller pieces each piece is called a shard. will increase search perfomance.
- Replica: Replica of each shard and will improve availability and search performance
Overview
Amazon rebranded most recent version of ElasticSearch in 2021 as OpenSearch. OpenSearch is a self-managed service of AWS for logs. Our current cluster has:
- 3 master nodes
- 5 hot data nodes of 1 TB capacity
- 4 Warm nodes of 1 TB capacity
- s3 bucket for cold storage
As this service is self-managed, we don’t have access to nodes and s3 directly. The only way we can get access to it is via OpenSearch REST API or Kibana UI. But we are responsible for node capacities and so.
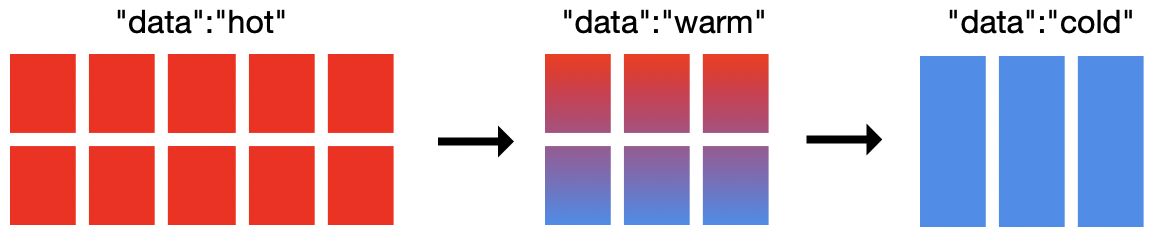
Index State Management (ISM)
As I mentioned in the previous section, our cluster has 3 different storage. In order to move indices between storages we use ISM to define the policy.
Right now all indices have ISM policy which will move them:
- From Hot storage to Warm storage: After 32 days
- From Warm storage to Cold storage: After 90 days
Shards and Replicas
By default, whenever you create a new index it will have five shards and two replicas. If the size of index low this situation will cause over-sharding. Which means instead of increasing the search performance it will decrease it and will cause frequent yellow state of cluster. based on AWS documentation, it is recommended to have more than one shards if the index is higher than 30GB. Based on this, our policy for shards and replicas is 1 shard and 1 replica for each index.
Make sure the ISM is working properly because the high level of shards will cause frequent yellow states of OpenSearch.
The number of shards and replicas are defined at the index level, so you cannot change them after index creation. If you want to change these parameters, you should do reindexing.
Index Mapping
OpenSearch has two different mapping, dynamic mappings, and explicit mappings. We faced so many issues in dynamic mappings because sometimes OpenSearch defined different types of fields and caused so many errors in search. From Fall 2022, all our current indecies have explicit mappings, and we only give support to these indices.
SnapShots and backups
Each hour AWS create a snapshot of OpenSearch indecies, you can use these commands in DevTool to access to them:
# List of available snapshots
GET /_snapshot/cs-automated-enc/_all

# Restore the relevant indices from snapshot
POST /_snapshot/cs-automated-enc/<SNAPSHOT ID>/_restore
Dashboards
You can create different visualization panels and put them together and create a Dashboard.
We have some dashboards you can see in Navigation bar at the left > Dashboard :
| Num | Dashboards |
|---|---|
| 1 | Cloudtrail |
| 2 | SSO Adaption |
| 3 | EKS Ace Test - Applications |
| 4 | EKS Ace Prod - Applications |
| 5 | EC2 Syslogs |
| 6 | Sagemaker |
| 7 | Epsilon Airflow Dev |
| 8 | Epsilon Airflow UAT |
| 9 | Epsilon Airflow Prod |
There are good resources to start creating dashboards: ElasticSearch document and OpenSearch document. While you can get idea other already existed dashboards/visualizations.
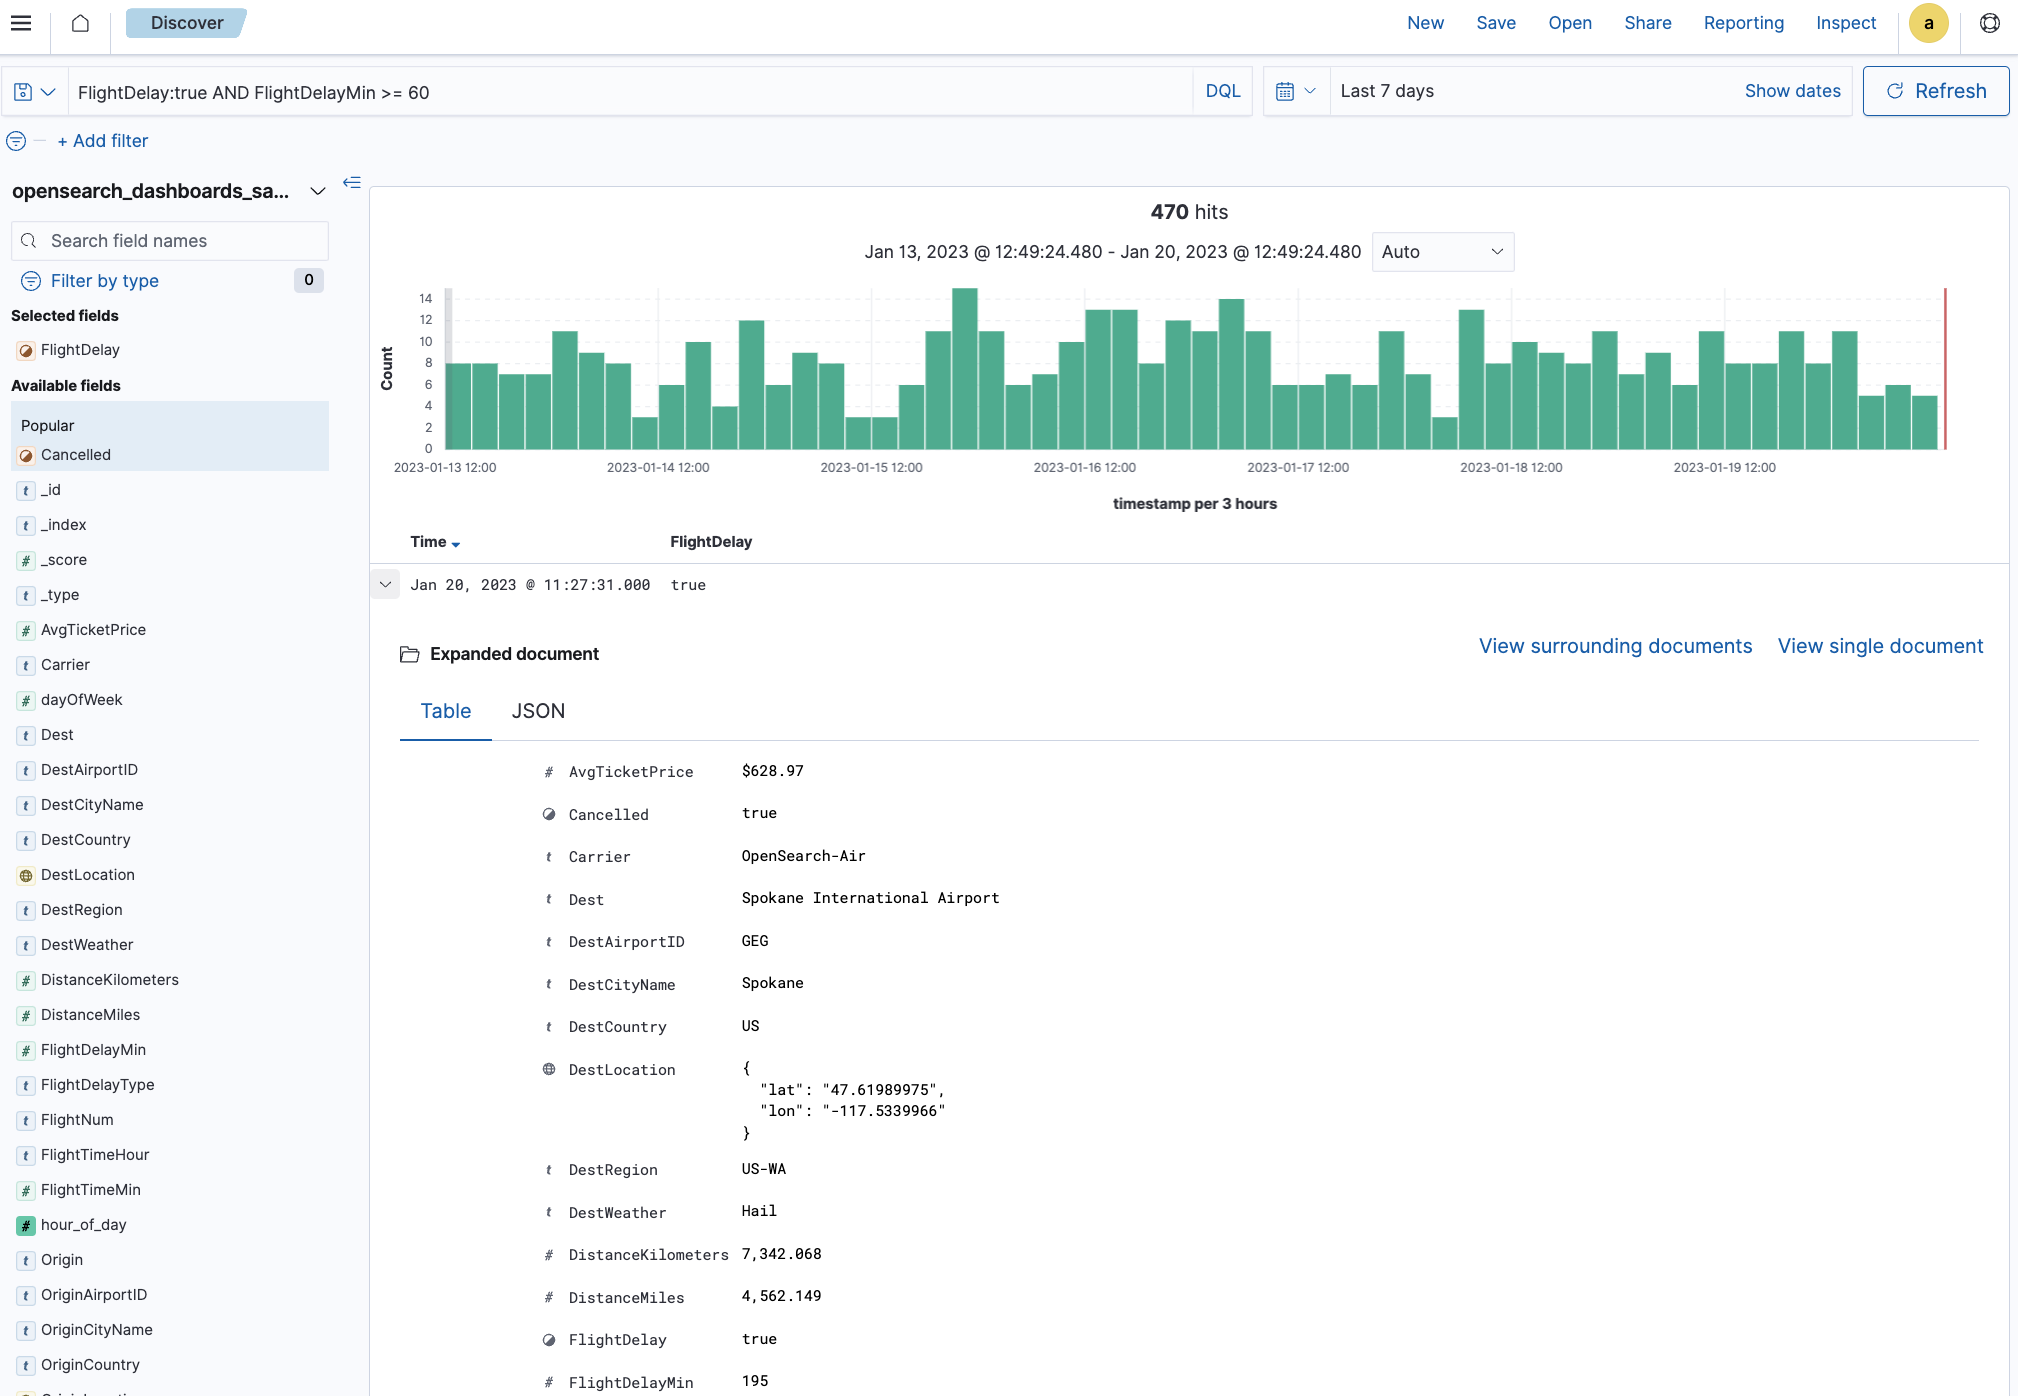
Exploring data
While you can use dashboards to get the information you are looking for, searching in the search field can be tricky. There is a good tutorial on OpenSearch Documents that you can start with.
Services
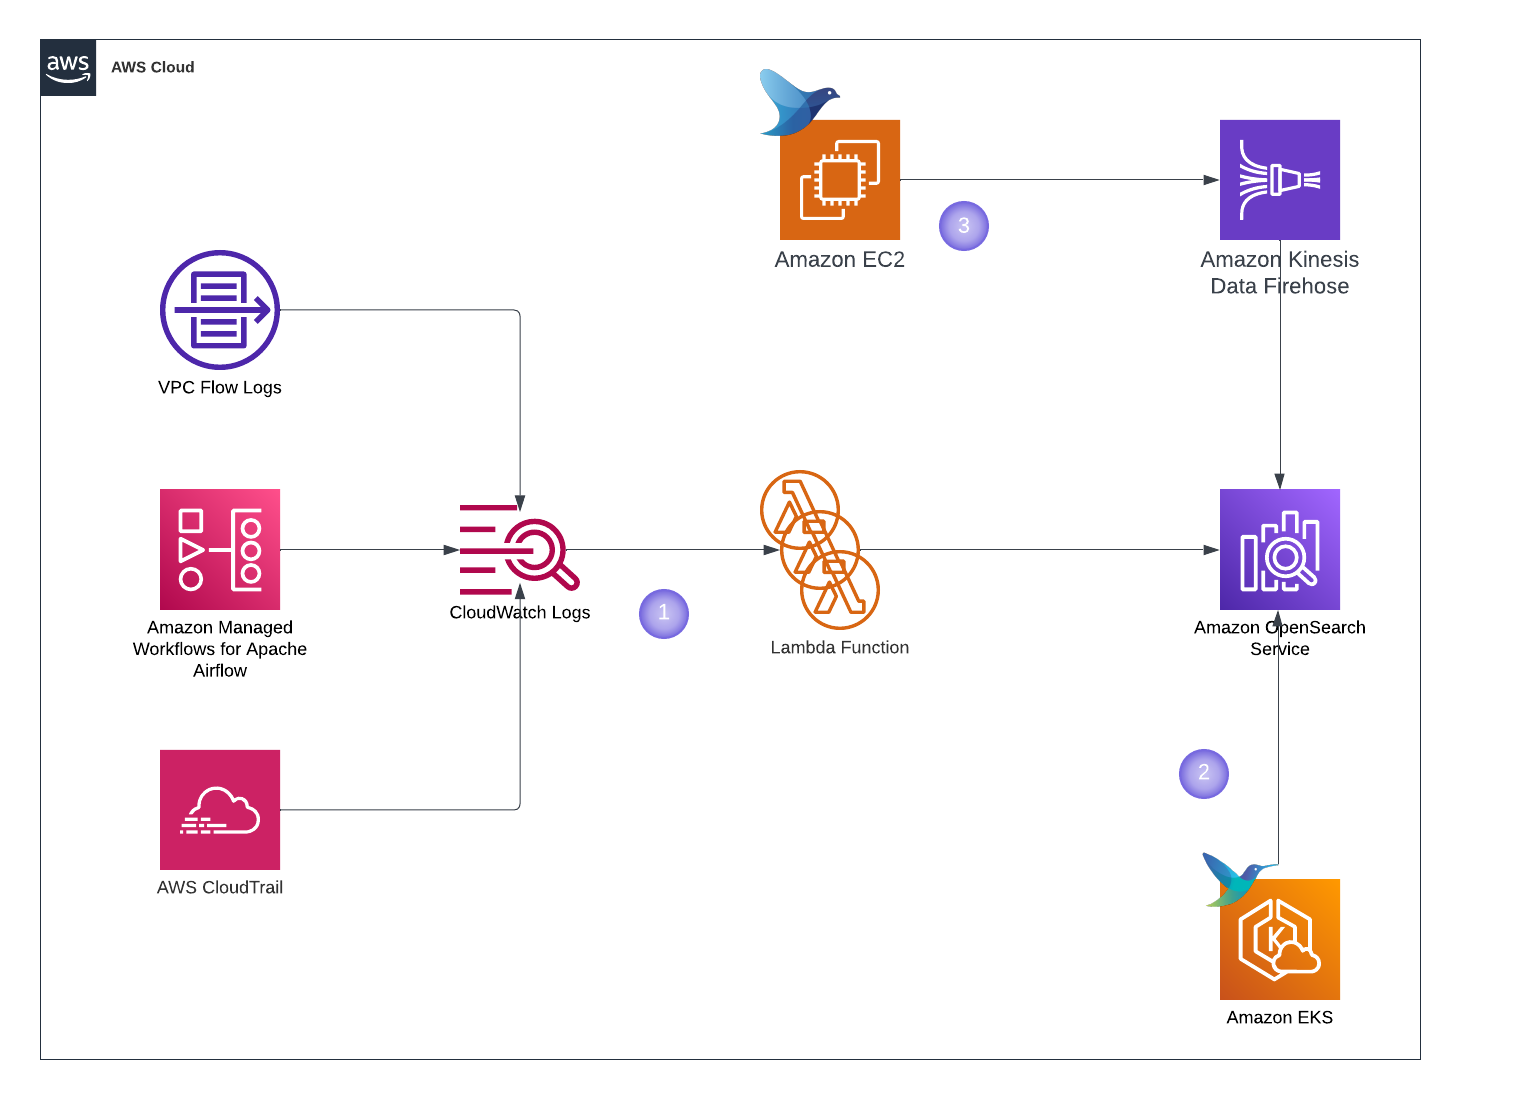 Here is the list of services sending their logs to OpenSearch:
| Service | Terraform Configs |
|---|---|
| CloudTrail (1) | us-west-2/cloudtrail-prod |
| Flow Logs (1) | us-west-2/vpc-flowlogs |
| Epsilon Airflow Dev (1) | us-west-2/epsilon-dev |
| Epsilon Airflow UAT (1) | us-west-2/epsilon-uat |
| Epsilon Airflow Prod (1) | us-west-2/epsilon-prod |
| EKS Prod - ControlPlane (1) | us-west-2/eks-ace-prod/controlplane_logs.tf |
| EKS Prod - Application (2) | us-west-2/eks-ace-prod/fluent_bit.tf |
| EKS Test - ControlPlane (1) | us-west-2/eks-ace-test/controlplane_logs.tf |
| EKS Test - Application (2) | us-west-2/eks-ace-test/fluent_bit.tf |
| EC2 Syslogs (3) | us-west-2/infra-syslogs-usw2 |
DevTool
For my infra pals, dev tool is your friend. Navigation bar at the left > DevTool
Here are useful commands you can use for administration purposes:
## Status of Cluster
GET _cluster/health
## About nodes
GET _cat/nodes?v## List all the indices in the cluster
# r means replica shards
# p means primary shards
GET _cat/indices?v## Get index mapping of explicit index
GET /<index_name>/_mapping## GET index templates
GET _template/<template_name>## Search if index has specific field
GET <index_name>/_search
{
"query": {
"exists": {
"field": "<field_name>""
}
}
}## Seach of index has specific term
GET <index_name>/_search
{
"query": {
"term":{
"<field_name>": "<field_value>"
}Monitoring & Alerting
We have full Grafana Dashboard and alerting for OpenSearch:
FAQ
1. We want to send logs to OpenSearch, what should we do?
The solution is different based on source of logs. To send Cloudwatch log groups to OpenSearch you can use the Flow Logs code to get the idea.
2. User don’t have access to OpenSearch, How to check it?
All users in okta have read-only access to OpenSearch, first check if user is part of Everyone group in Okta. Then request its SAML Trace to see what group attribute is being passed.